ACC2026
Miami Hurricanes
622 plays from scrimmage
Record
8-1
Conference
6-0

Leading producers
| Player | Pos | G | Pass yd | Pass TD | Rush yd | Rush TD | Rec | Rec yd | Rec TD | Prod |
|---|---|---|---|---|---|---|---|---|---|---|
 Malachi Toney | WR | 8 | - | - | 61 | - | 73 | 1027 | 13 | 259.8 |
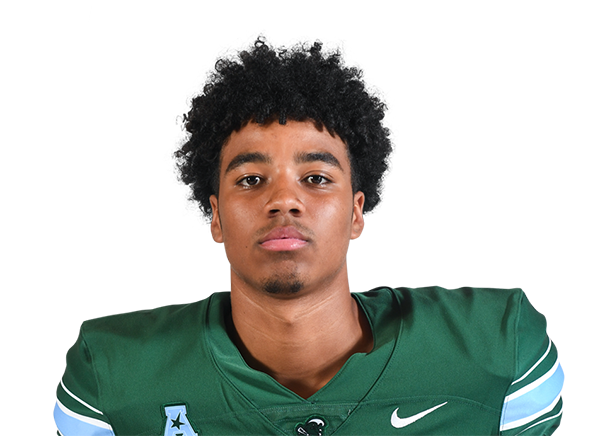 Darian Mensah | QB | 9 | 2701 | 28 | 137 | 2 | - | - | - | 243.7 |
 Mark Fletcher Jr. | RB | 8 | - | - | 514 | 9 | 8 | 91 | 1 | 128.5 |
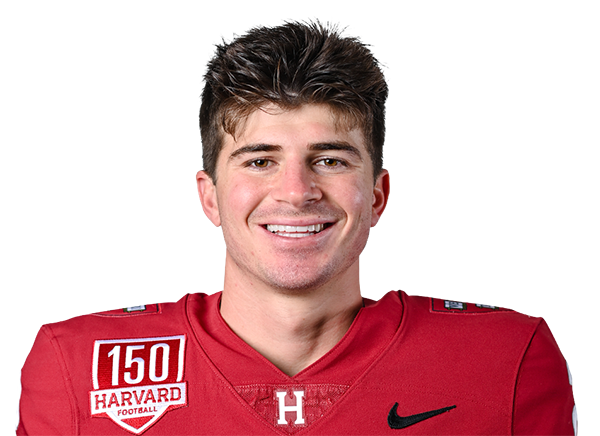 Cooper Barkate | WR | 9 | - | - | - | - | 38 | 464 | 6 | 120.4 |
 Javian Mallory | RB | 9 | - | - | 509 | 7 | 7 | 64 | - | 106.3 |
 Elija Lofton | TE | 9 | - | - | - | - | 27 | 349 | 3 | 79.9 |
 Daylyn Upshaw | WR | 9 | - | - | - | - | 24 | 280 | 2 | 64.0 |
 Vandrevius Jacobs | WR | 5 | - | - | - | - | 11 | 189 | 1 | 35.9 |
 Somourian Wingo | WR | 8 | - | - | - | - | 9 | 144 | 1 | 29.4 |
 Girard Pringle Jr. | RB | 7 | - | - | 86 | 1 | 4 | 43 | - | 22.9 |
 Luke Nickel | QB | 3 | 204 | 3 | 5 | - | - | - | - | 19.7 |
 Chris Wheatley-Humphrey | RB | 3 | - | - | 116 | 1 | 1 | 7 | - | 19.3 |
 CharMar Brown | RB | 3 | - | - | 97 | 1 | 2 | 12 | - | 18.9 |
 Jordan Lyle | RB | 6 | - | - | 100 | - | 3 | 16 | - | 14.6 |
 Dereon Coleman | QB | 1 | 30 | - | 25 | - | - | - | - | 3.7 |
Season by season
2004–2026, summed from the box scores of the players above. ESPN’s college coverage starts in 2004.
| Season | Pass yd | Pass TD | Int | Rush yd | Rush TD | Rec yd | Rec TD |
|---|---|---|---|---|---|---|---|
| 2026 | 2,935 | 31 | 3 | 1,650 | 21 | 2,686 | 27 |
| 2025 | 4,051 | 32 | 12 | 2,428 | 27 | 3,653 | 32 |
| 2024 | 4,527 | 41 | 8 | 2,449 | 30 | 4,175 | 37 |
| 2023 | 3,354 | 23 | 14 | 2,253 | 24 | 3,219 | 23 |
| 2022 | 2,868 | 18 | 12 | 1,483 | 10 | 2,823 | 17 |
| 2021 | 3,844 | 30 | 10 | 1,494 | 20 | 3,665 | 28 |
| 2020 | 3,049 | 26 | 6 | 1,789 | 18 | 2,916 | 25 |
| 2019 | 3,239 | 27 | 10 | 1,499 | 15 | 3,167 | 25 |
| 2018 | 2,144 | 19 | 14 | 2,454 | 23 | 1,936 | 17 |
| 2017 | 3,153 | 26 | 14 | 2,090 | 19 | 3,105 | 26 |
| 2016 | 3,532 | 27 | 7 | 1,863 | 23 | 3,513 | 26 |
| 2015 | 3,606 | 18 | 9 | 1,574 | 19 | 3,584 | 18 |
| 2014 | 3,249 | 26 | 12 | 2,393 | 18 | 3,081 | 26 |
| 2013 | 3,452 | 25 | 14 | 2,082 | 25 | 3,294 | 24 |
| 2012 | 3,545 | 23 | 7 | 1,732 | 19 | 3,369 | 22 |
| 2011 | 2,785 | 21 | 11 | 1,755 | 18 | 2,752 | 21 |
| 2010 | 3,105 | 21 | 27 | 2,401 | 19 | 2,902 | 19 |
| 2009 | 3,352 | 24 | 17 | 1,812 | 21 | 3,275 | 24 |
| 2008 | 2,556 | 22 | 20 | 1,678 | 16 | 2,403 | 21 |
| 2007 | 2,003 | 15 | 20 | 1,764 | 13 | 1,839 | 12 |
| 2006 | 2,527 | 15 | 15 | 1,523 | 13 | 2,454 | 13 |
| 2005 | 2,589 | 20 | 12 | 1,688 | 18 | 2,300 | 19 |
| 2004 | 2,812 | 22 | 6 | 1,545 | 15 | 2,570 | 20 |