SEC2026
Vanderbilt Commodores
578 plays from scrimmage
Record
4-5
Conference
1-5

Leading producers
| Player | Pos | G | Pass yd | Pass TD | Rush yd | Rush TD | Rec | Rec yd | Rec TD | Prod |
|---|---|---|---|---|---|---|---|---|---|---|
 Junior Sherrill | WR | 9 | - | - | 5 | - | 56 | 747 | 4 | 155.2 |
 Jared Curtis | QB | 8 | 1657 | 8 | 172 | 2 | - | - | - | 119.5 |
 Sedrick Alexander | RB | 9 | - | - | 333 | 6 | 17 | 153 | 1 | 107.6 |
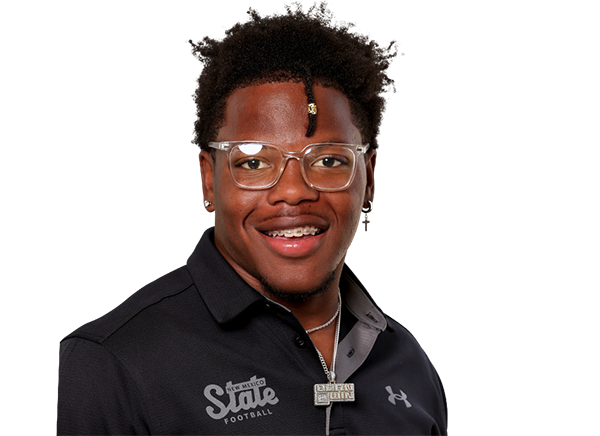 Makhilyn Young | RB | 9 | - | - | 277 | 2 | 10 | 76 | - | 57.3 |
 Ja'Cory Thomas | WR | 7 | - | - | - | - | 16 | 232 | 2 | 51.2 |
 Tristen Brown | WR | 8 | - | - | - | - | 17 | 228 | - | 39.8 |
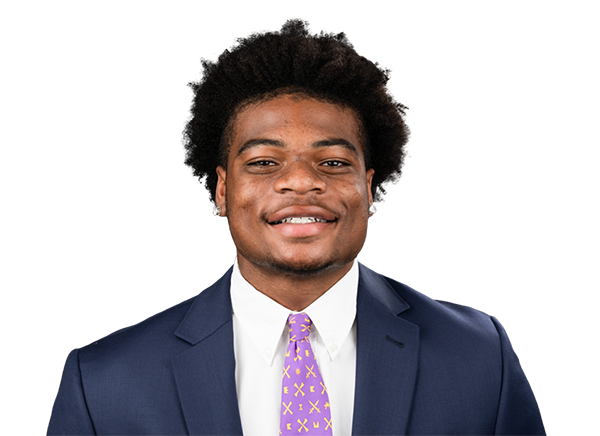 Jayvontay Conner | TE | 6 | - | - | - | - | 16 | 168 | 1 | 38.8 |
 Blaze Berlowitz | QB | 5 | 386 | 1 | 110 | 1 | 1 | - | - | 36.4 |
 Cole Spence | TE | 6 | - | - | - | - | 12 | 141 | - | 26.1 |
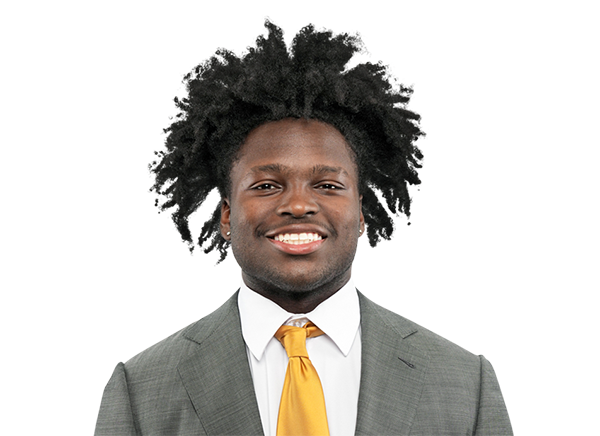 Jamezell Lassiter | RB | 9 | - | - | 105 | 1 | 4 | 32 | - | 23.7 |
 Kayleb Barnett | WR | 4 | - | - | 2 | - | 7 | 36 | - | 10.8 |
 Evan Hampton | RB | 5 | - | - | 18 | - | 1 | -1 | - | 2.7 |
Season by season
2004–2026, summed from the box scores of the players above. ESPN’s college coverage starts in 2004.
| Season | Pass yd | Pass TD | Int | Rush yd | Rush TD | Rec yd | Rec TD |
|---|---|---|---|---|---|---|---|
| 2026 | 2,043 | 9 | 9 | 1,011 | 12 | 1,812 | 8 |
| 2025 | 3,670 | 30 | 8 | 2,239 | 34 | 3,575 | 28 |
| 2024 | 2,322 | 21 | 4 | 1,809 | 18 | 2,214 | 18 |
| 2023 | 2,684 | 23 | 12 | 1,141 | 10 | 2,512 | 21 |
| 2022 | 2,248 | 22 | 6 | 1,889 | 12 | 1,966 | 21 |
| 2021 | 2,272 | 13 | 14 | 1,490 | 8 | 2,216 | 12 |
| 2020 | 1,979 | 13 | 11 | 991 | 4 | 1,937 | 13 |
| 2019 | 2,064 | 10 | 10 | 1,499 | 10 | 1,957 | 10 |
| 2018 | 3,248 | 24 | 7 | 2,128 | 22 | 2,911 | 22 |
| 2017 | 2,917 | 27 | 10 | 1,317 | 14 | 2,772 | 25 |
| 2016 | 2,486 | 9 | 11 | 2,136 | 26 | 2,346 | 6 |
| 2015 | 2,036 | 11 | 15 | 1,847 | 9 | 1,749 | 10 |
| 2014 | 2,149 | 13 | 19 | 1,278 | 7 | 1,846 | 11 |
| 2013 | 2,958 | 15 | 16 | 1,803 | 33 | 2,852 | 13 |
| 2012 | 2,774 | 17 | 5 | 2,189 | 25 | 2,755 | 17 |
| 2011 | 2,235 | 15 | 18 | 2,070 | 26 | 2,066 | 14 |
| 2010 | 1,913 | 11 | 11 | 1,714 | 13 | 1,854 | 10 |
| 2009 | 1,756 | 6 | 10 | 1,895 | 11 | 1,669 | 4 |
| 2008 | 1,594 | 14 | 12 | 1,760 | 13 | 1,502 | 14 |
| 2007 | 2,117 | 17 | 12 | 1,721 | 13 | 1,864 | 14 |
| 2006 | 2,415 | 16 | 14 | 1,778 | 17 | 2,307 | 16 |
| 2005 | 3,086 | 21 | 9 | 1,274 | 16 | 3,024 | 21 |
| 2004 | 1,847 | 9 | 5 | 1,479 | 15 | 1,816 | 9 |